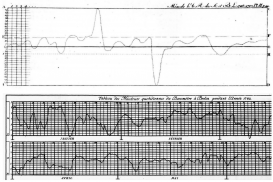
This project examines the use of barometric charts by late eighteenth-century meteorologists, such as Nikolaus von Béguelin (Berlin) and Marc-Auguste Pictet (Geneva). While graphical representations of experimental results were almost never used in the eighteenth-century, meteorologists relied on barometric charts either to correlate the variation of atmospheric pressure with various astronomical phenomena (such as the phases of the moon), or to display “at a glance” the full range of daily measurements for a whole year. It was such practical and theoretical considerations specific to the study of the weather which motivated the spread and use of graphical representations at the end of the eighteenth century.
Contrary to previous studies, this project shows that in the late eighteenth and early nineteenth centuries graphical representations were not seen as the application of a general geometrical method, but they were rather defined and understood in direct analogy with the barometric charts which acted as paradigmatic curves. This project will show a direct connection between the weather charts of eighteenth-century meteorology and the graphical activity of William Playfair, Alexander von Humboldt, and Joseph Louis Gay-Lussac.