In climate science today, the concepts of “global warming” and “global climate” are ubiquitous. They have become not only the science’s central concerns, but also its public—and sometimes politicized—emblems. Climate today is no longer just the average of weather; it is also the average of the earth’s geography. But when and how did this notion of a unitary worldwide climatic system emerge?
In my research project “From Herodotus to Global Circulation,” I examine the development of the emergent field of climatology from the nineteenth to the early twentieth century, focusing on the slow and always contentious shift from regional geographic to physical and atmospheric concerns. Through a history of data collection and data usage among practitioners, I trace the rise of an early conception of climate as a global phenomenon, which first crystallized in the last decades of the nineteenth century.
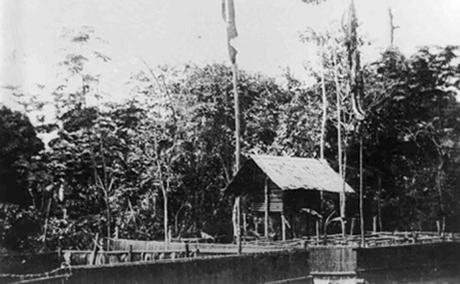
Figure 2: Meteorological station in German Cameroon, c. 1900 (Bildarchiv der Deutschen Kolonialgesellschaft, Universitätsbibliothek Frankfurt, http://www.ub.bildarchiv-dkg.uni-frankfurt.de).
In order to better understand and visually represent the spatial dimension of the development of climatology, my research assistant Erna Andersson and I have recently started work on the digital companion project “Mapping Climatology.” Using the MPIWG’s Platin software, we set out to track and visualize the places of provenance of the climate data used by European practitioners from the late nineteenth to the early twentieth century. These data, gathered in different places around the world and under widely varying conditions, allowed climatologists not only to compare climatic conditions across regional and continental borders, but to produce charts and maps of climatic conditions and phenomena around the entire globe (Fig. 1).
At this stage of the project, we are extracting information from the three German journals that published the majority of climatological articles in the last decades of the long nineteenth century: Petermanns Mitteilungen, the Geographische Zeitschrift, and the Meteorologische Zeitschrift. To reconstruct the geographical extent of German climatology, we first select all articles that use qualitative and/or quantitative data from non-European environments. After geo-tagging the articles, we visualize the places of provenance on an interactive world map, which users will ultimately be able to manipulate according to their own interests and research questions (see the example map for 1895–1899, Fig. 3).
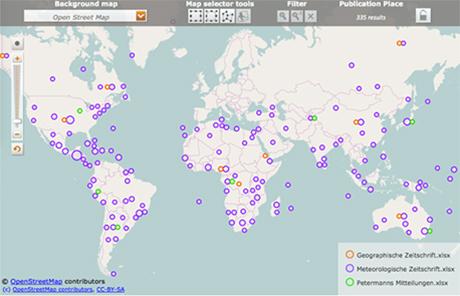
Figure 3: Map showing the extra-European places of data provenance in climatological articles from 1895-1899 in three German journals (Petermanns Mitteilungen, Geographische Zeitschrift, Meteorologische Zeitschrift).
Even at first glance, the maps reveal the global and colonial extent of late nineteenth-century climatology, with articles using data from Greenland to South Africa and from India to the Pacific Islands. German climatologists—or rather, the practitioners who published in German-language journals—were not restricted to German meteorological stations and expeditions, but had access to data from a wide range of places around the earth. Although a truly international network of meteorological observation was still only an ambitious idea in the late nineteenth century, a dense informal network of data sharing was already well established.
Beyond visualizing the geographical scope of climatology at different times, “Mapping Climatology” will also inspire questions for further qualitative research—from inquiries into the role of new technologies of observation in the spatial expansion of the meteorological and climatological vision, to questions about the connection between data gathering and economic or political developments such as the Scramble for Africa. In the sample map visualizing climatological articles from Petermanns Mitteilungen in three different periods from 1885 to 1929 (Figs. 4 and 5), the data from Africa emphasize the German colonies and particularly German East Africa, reflecting the deeply colonial dimension of the development of meteorology and climatology around the turn of the twentieth century.
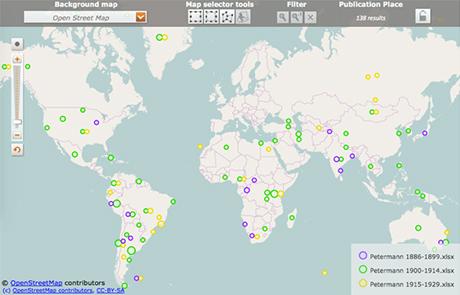
Figure 4: Map showing the extra-European places of data provenance in climatological articles in Petermanns Mitteilungen for three fifteen-year period; created with Platin-Software.
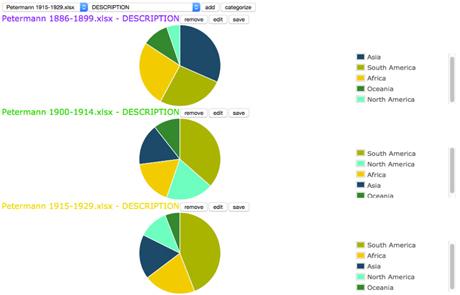
Figure 5: Map showing the extra-European places of data provenance in climatological articles in Petermanns Mitteilungen for three fifteen-year period; created with Platin-Software.
A visual representation of the provenance of data can certainly not do complete justice to the complexity of climatological research, and may even obscure some of the differences inherent in the climatological articles: the data points on the Platin maps do not differentiate between the kinds of evidence used, and they do not distinguish different levels of completeness—or rather of “density”—in the data series available to researchers. For my work on the development of the science of climatology, however, the maps provide visual confirmation of the global concerns that nineteenth-century practitioners exhibited in their work. They reveal the importance of the colonial context in the emergence of climatological conceptions of an interconnected and globe-spanning climatic system. In a wider sense, “Mapping Climatology” also corroborates the argument that a period of rapid globalization in the late nineteenth century affected not only economic and social spheres, but also the realm of scientific practice and environmental conceptions. As for climate science today, the project can encourage a critical examination of the concept of “global climate” by showing that its current omnipresence—along with its potential to flatten local specificities—is not an inevitable corollary of the science itself, but the result of a contingent and deeply historical process.
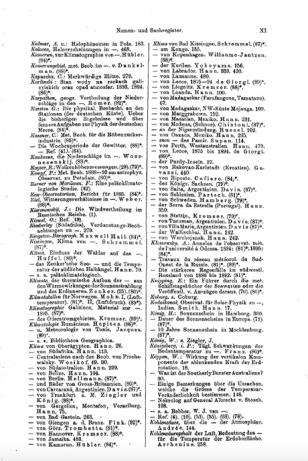
Figure 6: Excerpt from the index of the 1896 volume of the Meteorologische Zeitschrift, which served as one of the starting points for the data collection for “Mapping Climatology”.